Yamhill County Market Update: Affordability is Finally Improving
I have some encouraging news: for the first time in several years, the forces driving our local housing market are finally realigning in favor of stability.
Nationally, a full percentage-point drop in mortgage rates over the last year has expanded the pool of potential buyers by approximately 5.5 million households. In Yamhill County, this transition has created a Balanced Market where neither buyers nor sellers hold a distinct advantage.
With 96 homes currently seeing price reductions in our county, sellers are becoming more realistic, and buyers are regaining their footing. Whether you're looking to buy your first home or list your current property, the current stability offers a rare window of predictability.
A "Small-Wins" Year for Housing
We are entering what economists call a "small-wins" year. In Yamhill County, the median listing price has moderated to $581,000, and homes are spending a median of 97 days on the market. This slower pace is a welcome development, allowing for more thoughtful and less rushed decisions.
The Three Forces Rebuilding Affordability
According to the latest Monthly Market Report, the affordability crisis is being repaired by three critical fundamentals:
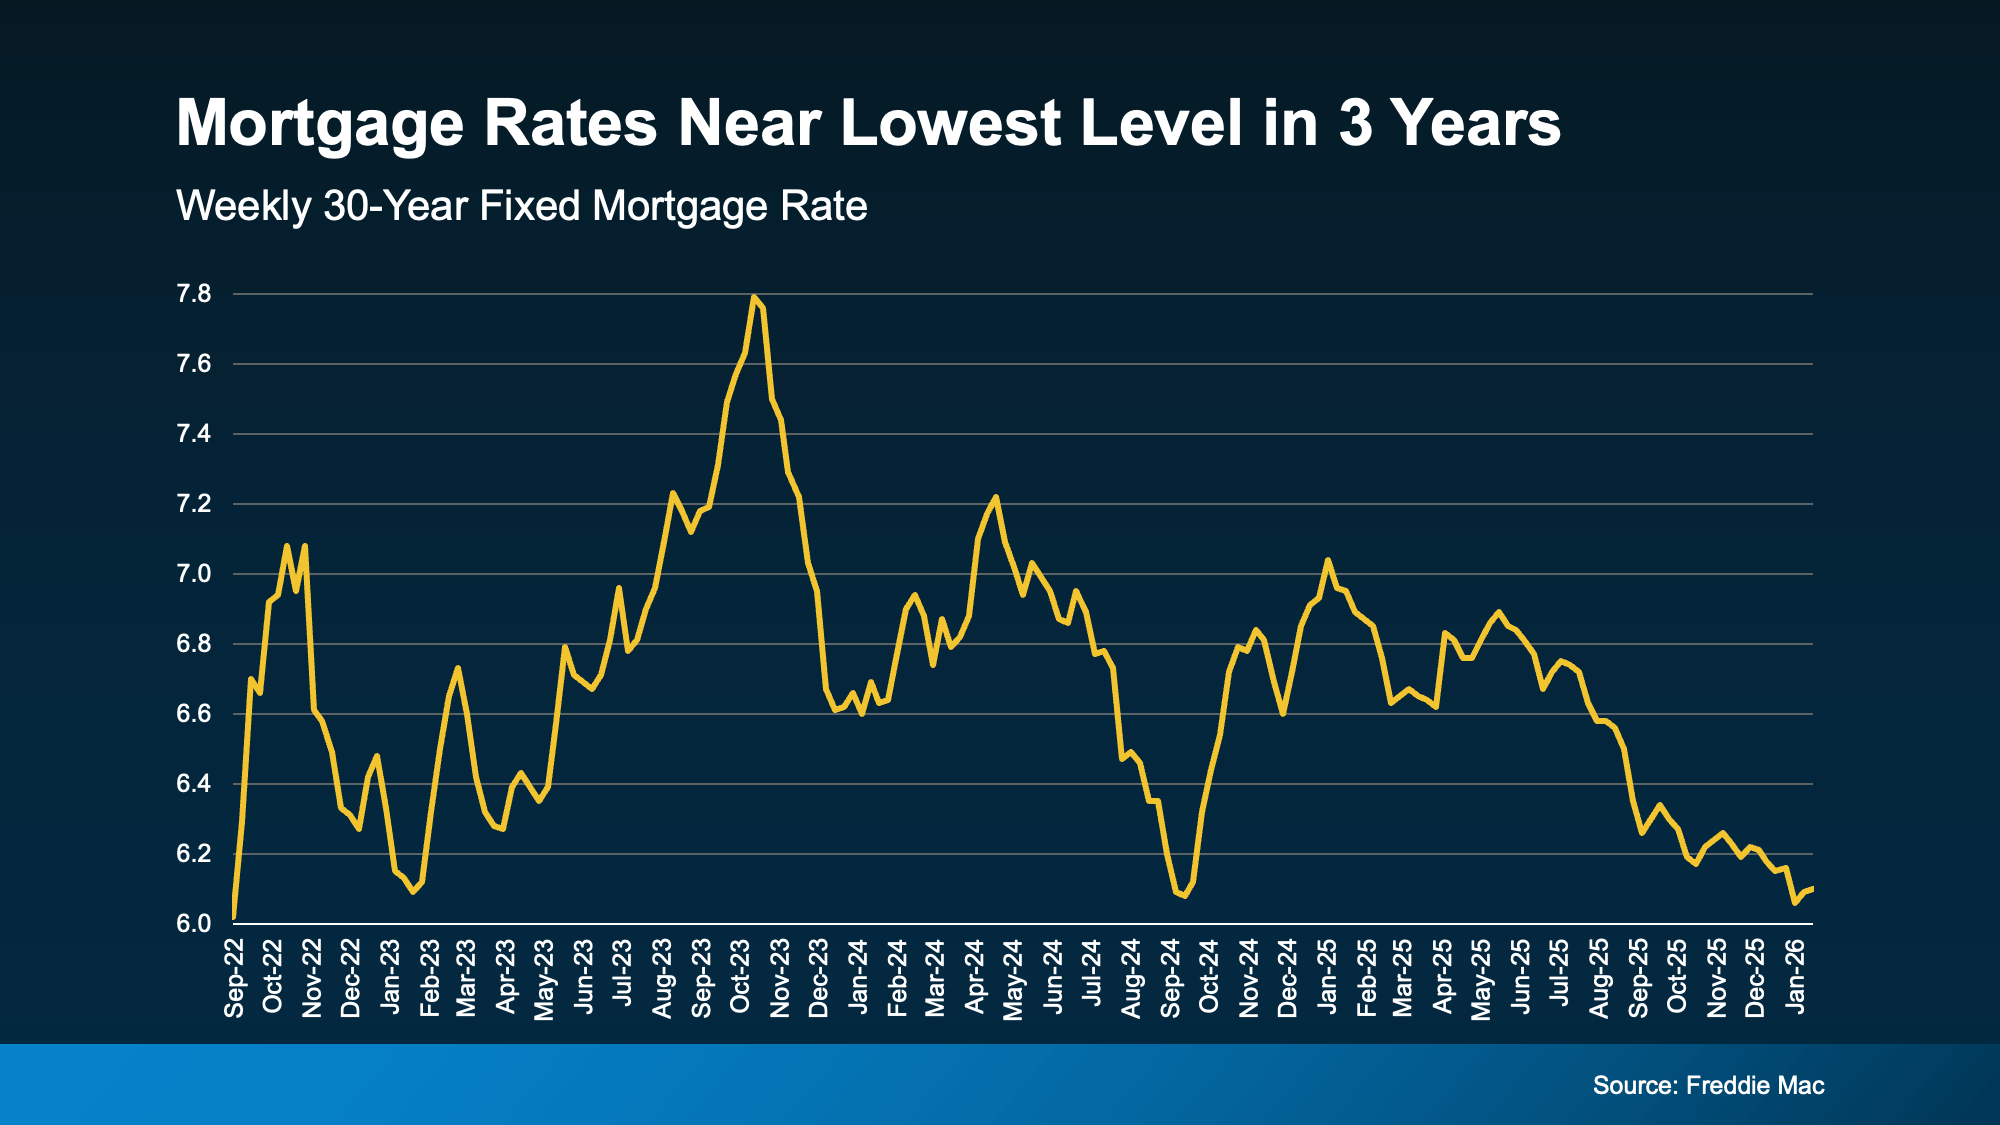
Mortgage Rates: Rates near 6.20% are significantly lower than their 7%+ peak in 2025.
Inventory Growth: Nationally, housing inventory rose 15% in 2025; locally, we see a 3.1 to 4.1-month supply.
Income Gains: In 2026, wage growth is forecast to outpace home price growth, repairing purchasing power for first-time buyers.
What This Means for You
For Buyers: You finally have breathing room. With more options and less pressure to waive inspections or appraisals, you can make confident, informed decisions.
For Sellers: Pricing and presentation are now your top priorities. Overpricing today leads to longer market times and price reductions, so it is essential to price correctly from the start.
For Investors: Stability creates a healthy environment for long-term returns. While some regions face price stagnation, Yamhill County's lifestyle demand—driven by our wine country and rural appeal—continues to support steady interest.
Affordability won't snap back overnight, but the ship is sailing in the right direction.
Why Your "Buying Power" is Booming
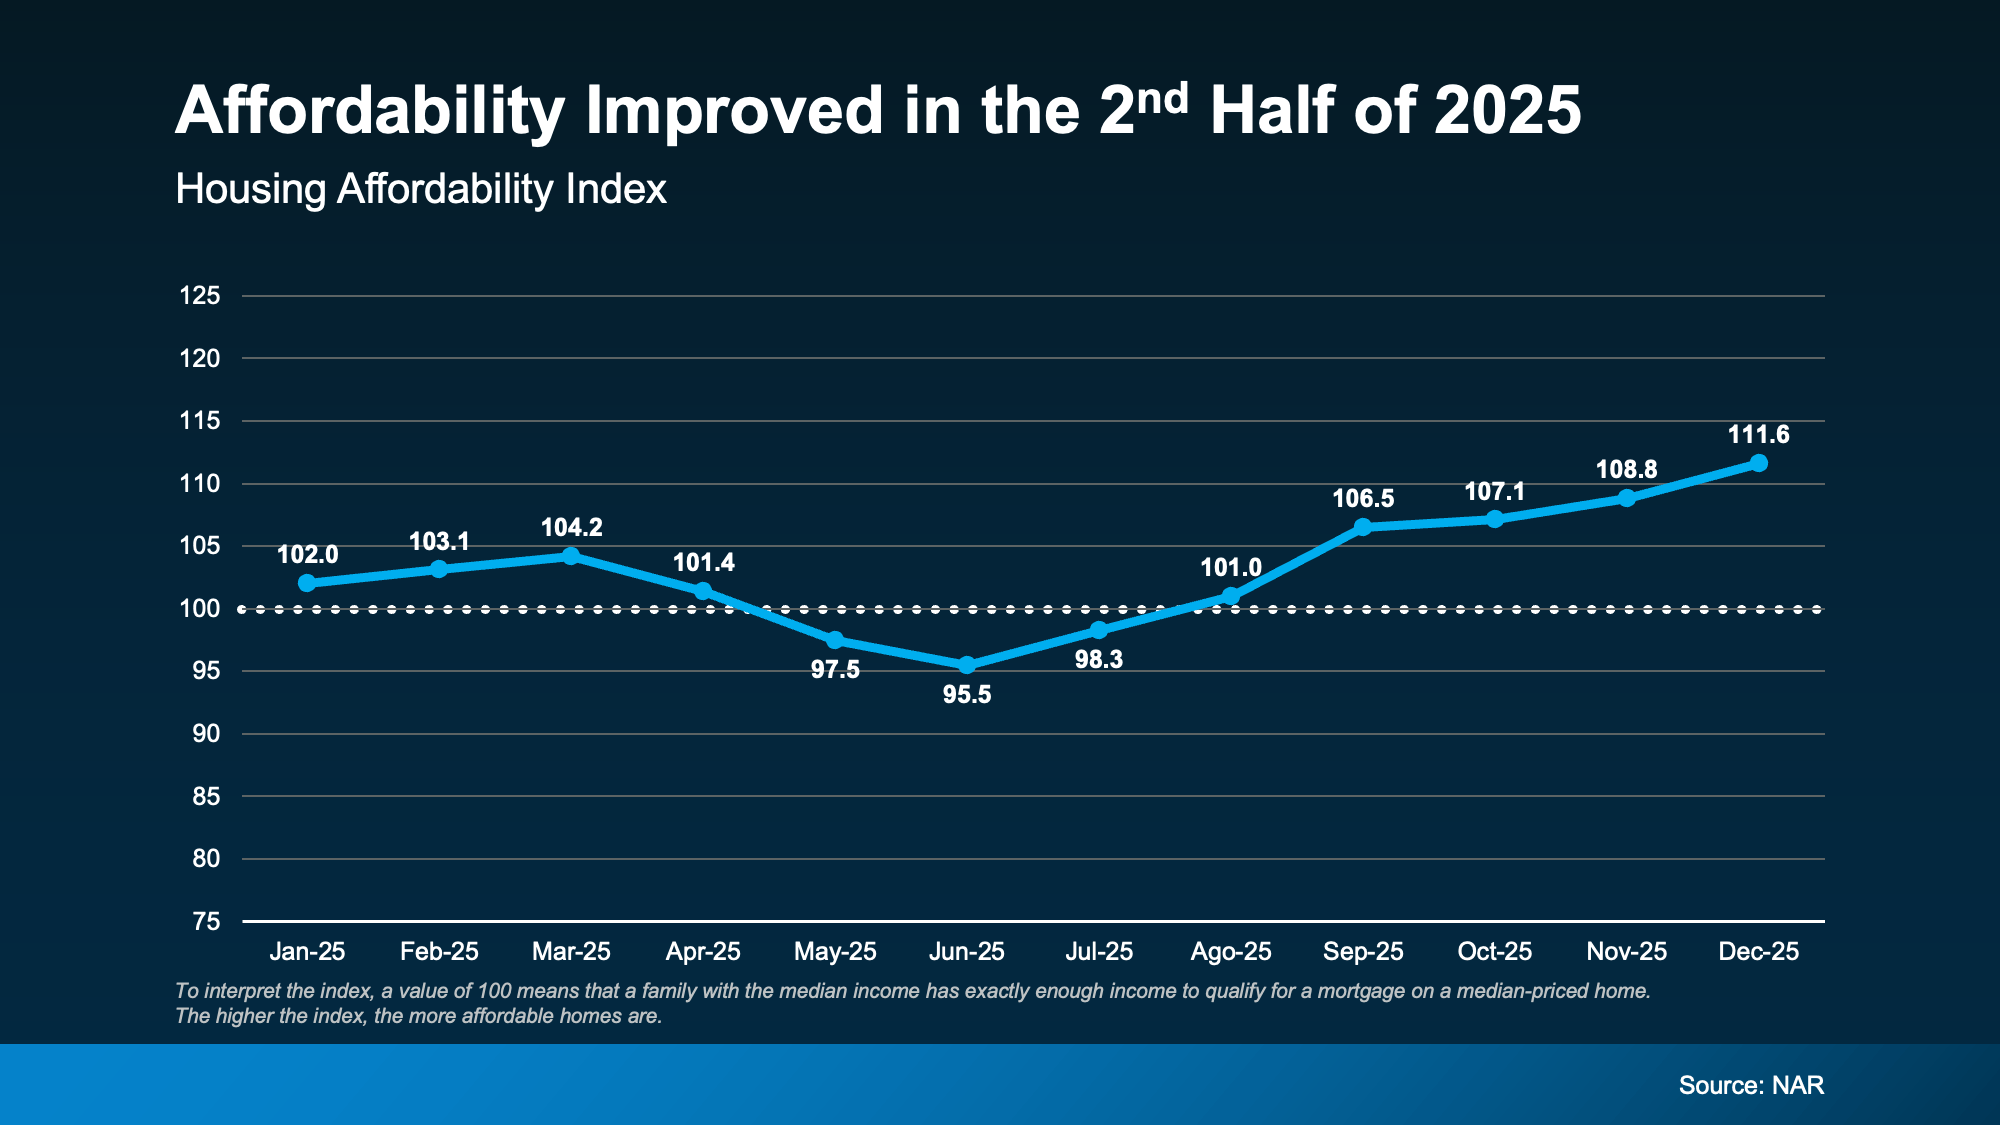
If you’ve been waiting for a sign to jump back into the market, this chart is it. The Housing Affordability Index is the ultimate heartbeat monitor for the real estate market—it tells us exactly how easy (or hard) it is for a typical family to buy a home.
What Do These Numbers Actually Mean?
Think of the 100 line (the white dotted line) as the "Break-Even Point."
At 100: A family with the median income has exactly enough money to qualify for a mortgage on a median-priced home.
Above 100: You have "Buying Power" to spare! Homes are more affordable
Below 100: The market is tight, and the average income isn't quite reaching the typical home price.
The 2025 "Comeback Story"
As you can see from the data, we had a rough start to last year. By June 2025, affordability dipped to 95.5—the lowest point of the year. At that moment, many buyers felt "stuck" as prices and rates peaked at the same time. But then, the tide turned.
Why the End of the Year Matters for You
Starting in the second half of 2025, the index began a steady, aggressive climb. We ended the year at a staggering 111.6 in December.
This is a massive shift for your wallet. A jump from 95 to 111 means that the "math" of buying a home has fundamentally improved. Whether it’s because mortgage rates eased up or because wages finally started outperforming home prices, the result is the same: It is significantly easier to qualify for a home today than it was six months ago.
Affordability has reached its strongest level in over three years. If you were told "no" by a lender last summer, the 111.6 index score suggests that today’s answer might be a "yes."
Why Affordability is Finally on Your Side
If you have been sitting on the sidelines of the real estate market, waiting for the "numbers to make sense," this chart is the breakthrough you’ve been looking for. The Housing Affordability Index is essentially the "buying power" scoreboard for the housing market—and right now, the score is trending heavily in your favor.
What This Chart Tells Us
This index measures whether a typical family, earning a median income, can qualify for a mortgage on a median-priced home.
The "Magic" 100 Line: Think of the white dotted line at 100 as the break-even point. At 100, the average family has exactly enough income to qualify for a home.
The Recovery: After a difficult dip in June 2025 (where affordability hit a low of 95.5), we have seen a massive rebound. We ended the year at 111.6, meaning the average family now has 11% more "buying power" than they did just six months ago
What This Means for You
🏠 For Home Buyers: The "Yes" You’ve Been Waiting For
If you were pre-approved a year ago and found that your budget didn't stretch far enough, it’s time to call your lender again. With the index sitting at 111.6, the "math" of buying a home has fundamentally improved. You are no longer just "barely qualifying"—you are entering the market with a cushion of affordability that hasn't existed in years.
✨ For Sellers: A Larger Pool of Qualified Buyers
High affordability isn't just good for buyers; it’s a massive win for sellers. When the index rises, it means more people can actually afford to buy your home. This increase in qualified buyers typically leads to steadier demand and more confident offers, helping you move your property without the stress of a "stagnant" market.
📉 For Downsizers: Maximizing Your Next Move
If you are looking to sell a larger family home and move into something smaller or more manageable, this chart is your green light. Not only can you sell your current home to a wider pool of buyers, but the increased affordability means your "next chapter" home will likely cost you less in monthly payments than you originally projected.
For home buyers, these charts provide a clear view of your growing purchasing power and why the market is becoming more accessible than it has been in several years.
1. Your Buying Power is Growing
The Housing Affordability Index (see image_d3b054.png) measures whether a typical family earns enough to qualify for a mortgage on a typical home.
The Baseline (100): A score of 100 means a family with the median income has exactly enough to qualify for a median-priced home.
The Recovery: After a difficult dip in mid-2025, the index climbed to 111.6 by December. This means the average buyer now has 11.6% more income than required to qualify, giving you significantly more leverage and options than you had just six months ago.
2. Monthly Costs are Trending Down
The most direct win for your wallet is the drop in monthly expenses (see image_d3b75a.png).
Lower Payments: The median monthly mortgage payment has dropped from a peak of $2,882 in May 2025 to $2,413 in January 2026.
Annual Savings: This decrease of nearly $470 per month puts over $5,600 back in your pocket every year compared to buyers who purchased last spring.
3. Rates are Finally Cooperating
The driver behind this improved affordability is the decline in mortgage rates (see image_d3b3f4.png).
3-Year Lows: Rates have steadily declined from nearly 8% in late 2023 to the low 6% range as of early 2026.
Qualifying is Easier: As rates drop, your "qualifying income" decreases, meaning you may now qualify for a loan that was out of reach a year ago.
4. Wages are Winning the Race
For the first time in recent years, wages are growing faster than home prices (see image_d34e98.png).
Income Edge: In 2026, wage growth is forecast at 4%, while home price growth has slowed to just 1%.
Closing the Gap: This "realignment" helps repair the affordability gap created during the pandemic, allowing your savings and income to go much further toward your down payment and monthly costs.
The combination of lower rates, rising wages, and declining monthly payments has created the most favorable buying environment since 2022. You now have more choice, more leverage, and a lower barrier to entry.
Key Stats
The market is shifting toward a "small-wins" phase where affordability is slowly returning.
Inventory Recovery: While total listing counts (390) have dropped from their August 2025 peak (518), the 3.1 months of inventory remains higher than the extreme lows seen in previous years.
Price Adjustments: Currently, there are 96 homes in the county with price reductions, an increase of 14 over the previous month.
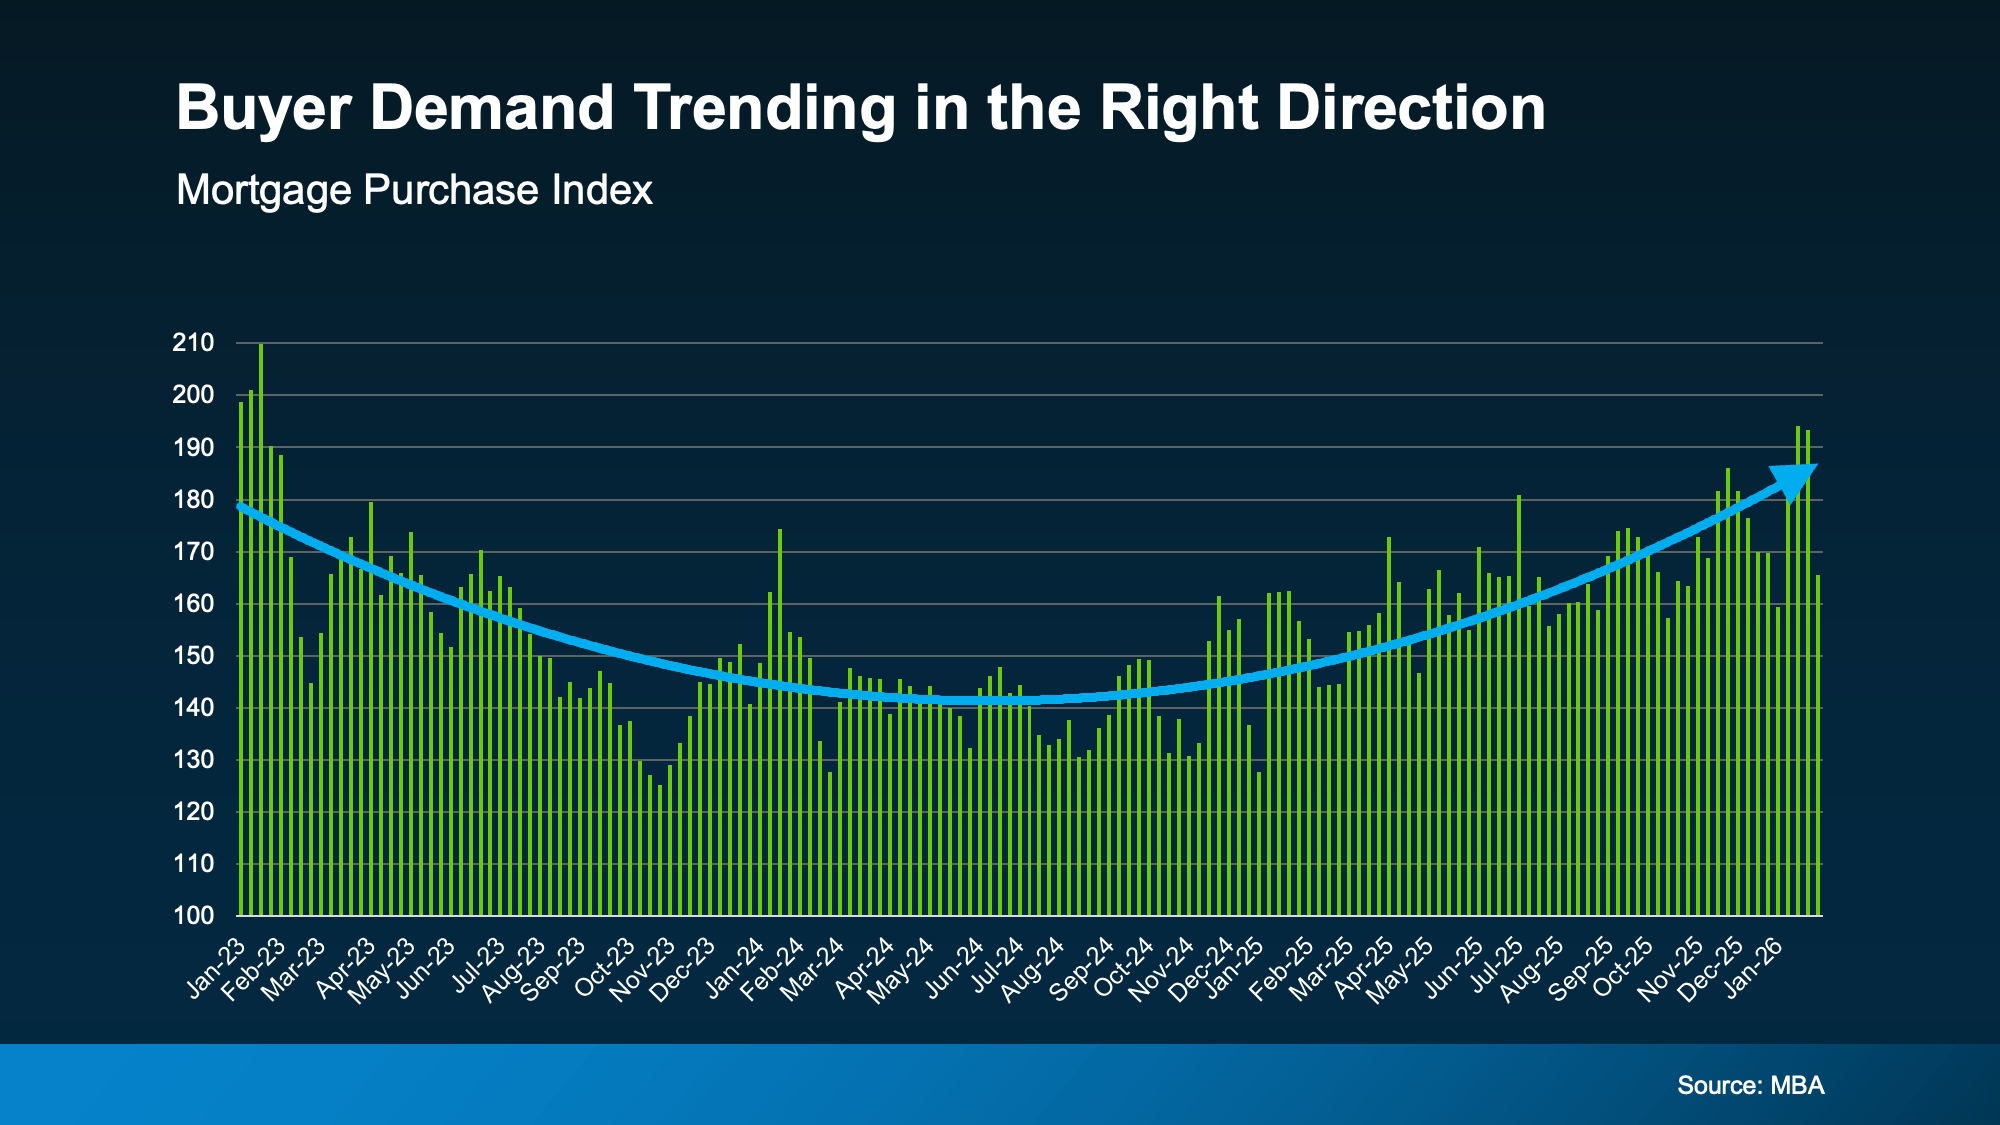
Buyer Sensitivity: Buyer demand is highly reactive to mortgage rates; every dip into the low 6% range triggers a fresh wave of market activity.
Income Alignment: Nationally and locally, wage growth is expected to outpace home price growth in 2026, which is gradually repairing buyer purchasing power.
The market isn’t “cheap,” but it is becoming more balanced, more stable, and more predictable.
And for buyers? That stability is powerful.
If you’ve been waiting for a better moment to buy, February 2026 is showing the clearest signs yet that affordability is moving in the right direction.
📩 Want a personalized home search and strategy?
Message us and we’ll send you a custom list of homes that match your budget and goals.